I’ve recently started blogging at Opex Analytics. I will still use this blog for material related to my courses I teach at Northwestern– and other interesting material. But, you may find other interesting material on the Opex Analytics blog site.

I’ve recently started blogging at Opex Analytics. I will still use this blog for material related to my courses I teach at Northwestern– and other interesting material. But, you may find other interesting material on the Opex Analytics blog site.
A recent WSJ special on Big Data had a section call Help Wanted! The first paragraph reads:
“Corporate executives face a daunting obstacle when it comes to reaping the benefits of big data: Who’s going to tell them what it all means?”
This is a real problem. As firms collect more and more data, they will need people who can productively make sense of it.
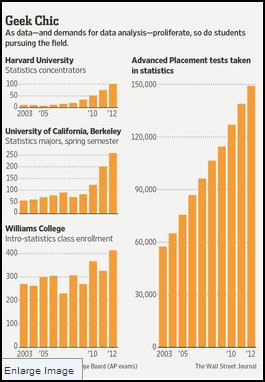
Fortunately, more people are getting trained in statistics (and analytics) to meet this demand. The WSJ ran an article called “Data Crunchers Now the Cool Kids on Campus” (the statistics are from that article.)
And, IBM, Ohio State, and others announced plans for an advanced analytics center in Columbus, OH to help train, do research, and help firms with analytics.
There is a lot of opportunity for people who can work with and make sense of data.
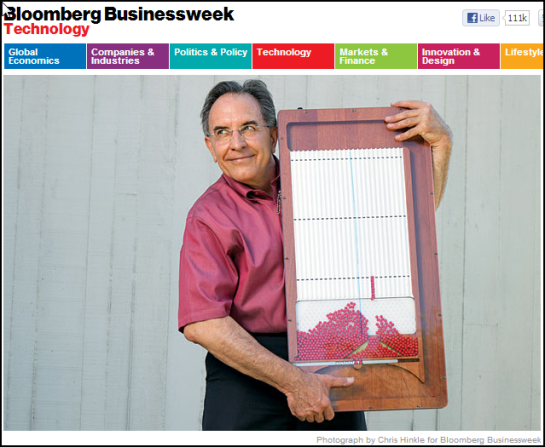
One of my favorite columns in Businessweek is the profile of someone doing something interesting in technology.
I was very pleasantly surprised to our field of optimization pop up last May (I meant to post earlier, but was only reminded because I am using this example in my optimization class tomorrow). Karl Kempf of Intel was profiled because of his ability to use mathematical optimization to improve Intel (and make race cars go faster and movie stunts more realistic).
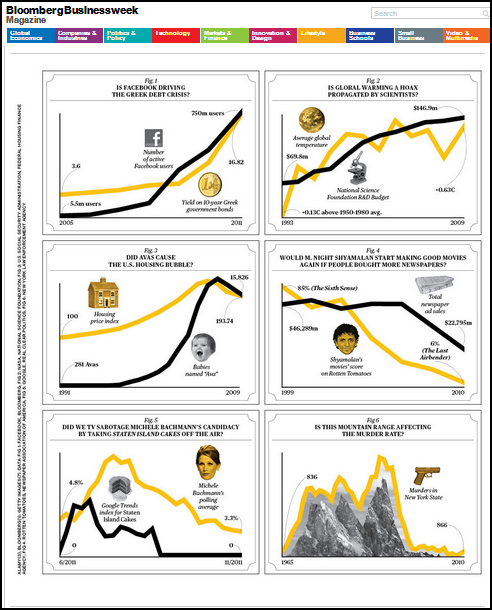
With greater access to more data sets, it is easier to do bad statistical work. BusinessWeek illustrated this in humorous way:
BusinessWeek recently ran an article on Coca Cola’s new orange juice plant. Although this article doesn’t give the details of their secret production formula (which they call Black Book), it looks like a nice application of the classic linear programming blending problem. It is also interesting to see all the other data collection and analytics that go into the process.
Here is a key passage from the article:
Black Book isn’t really a secret formula. It’s an algorithm. Revenue Analytics consultant Bob Cross, architect of Coke’s juice model, also built the model Delta Air Lines (DAL) uses to maximize its revenue per mile flown. Orange juice, says Cross, “is definitely one of the most complex applications of business analytics. It requires analyzing up to 1 quintillion decision variables to consistently deliver the optimal blend, despite the whims of Mother Nature.”
The Black Book model includes detailed data about the myriad flavors—more than 600 in all—that make up an orange, and consumer preferences. Those data are matched to a profile detailing acidity, sweetness, and other attributes of each batch of raw juice. The algorithm then tells Coke how to blend batches to replicate a certain taste and consistency, right down to pulp content. Another part of Black Book incorporates external factors such as weather patterns, expected crop yields, and cost pressures. This helps Coke plan so that supplies will be on hand as far ahead as 15 months. “If we have a hurricane or a freeze,” Bippert says, “we can quickly replan the business in 5 or 10 minutes just because we’ve mathematically modeled it.”

The Economist recently published an interesting article on how advances in security cameras are allowing stores to better track and respond to consumers.
It seems like it wasn’t too long ago that an average 3-year-old could easily beat a computer at determining someone’s gender by looking at a picture. Now, these cameras are getting better at determining gender as well as age of the shoppers in the store.
This advance really allows in-store retailers to catch-up with their on-line counterparts in terms of understanding customers: where do they spend their time, how long do they stay, what do they look at, and what do they ultimately buy?
The article provides an example of a retailer who determined when the number of shoppers peaked (it wasn’t when sales peaked) and built their staff schedules around that to generate more sales.
There is a lot more retailers can do with this information. It will be interesting to see how this evolves over the next few years.
DC Water suppliers water to 2 million customers in the Washington DC area with several thousand miles of pipes (with an average age of over 75 years) and maintains nearly 9000 fire hydrants. Several years ago, everything was tracked on paper.
IBM and DC Water have recently published several videos and articles on how DC Water has applied descriptive, predictive, and prescriptive analytics to the system with positive results.
This is a nice case study in the use of analytics.
The descriptive analytics allowed DC Water to map the location of the fire hydrants for better maintenance. With extra sensors it also allowed them to better monitor water useage and look for anomalies
With aging pipes, the predictive analytics allowed them to predict failures before they happened.
And, the prescriptive analytics allowed DC Water to better route maintenance crews to fix trouble tickets increasing the productivity of the maintenance team while driving down fuel cost.
IBM published several videos on the solution>
This first video is a nice high-level overview of the solution:
The second video provides more details of the solution:
The third video highlights the predictive analytics solution:
IBM also published a written document of the solution, but I found the videos very well done.
The Economist’s Jan 19th survey on Offshoring and Outsourcing made an interesting point about the rising value of data to an organization. The article mentioned that the outsourcing movement grew by moving non-essential, repetitive jobs to 3rd party provides (mostly in India).:
Some activities that used to be considered peripheral to a company’s profits, such as data management, are now seen as essential, so they are less likely to be entrusted to a third-party supplier thousands of miles away.
and this quote from GM’s CIO:
“IT has become more pervasive in our business and we now consider it a big source of competitive advantage,”
I have seen some articles argue that data is starting to be viewed as a critical economic input, just like capital and labor. These quotes tend to highlight that. If data is important to you, you do not want to simply outsource that to the lowest bidder.

A recent BusinessWeek article discussed GE’s entry into the Analytics space. GE is starting to put sensors on it industrial machines and building the capability to analyze that data.
As an example, the article’s opening paragraph mentions that a jet engine can collect a terabyte of data on one cross-country flight:
On Nov. 29, Jeff Immelt pulled out the really big iron.General Electric’s (GE) chief executive climbed up to take the stage at a modified film studio in San Francisco and stood next to a 6.87-ton jet engine built by his company. Inside this mass of twisted metal—Immelt told the spectators at the company’s Minds and Machines event—were 20 sensors that monitor the engine’s performance, generating part of the roughly 1 terabyte of information produced on a one-way, cross-country flight. In the years ahead, GE plans to analyze this information as it’s never been analyzed before in a quest to build smarter machines and more lucrative services that it can sell to customers.
The prize? With a 1% improvement, GE claims it can save its customers billions of dollars over a 15-year period.
This definitely fits the trend of firms putting sensors on various types of equipment to help drive improvements.
 Northwestern recently published an article on the research being done with complex networks.
The results have some nice applications:
The researchers studied a variety of biological, technological and social networks and found that all these networks have evolved according to basic growth mechanisms. The findings could be particularly useful in understanding how something — a disease, a rumor or information — spreads across a network.
